| Section 1.5
Linear Equations, Functions,
Zeros, and Applications
|
Linear Equation in 1 variable
•mx + b = 0
•m and b are real numbers
•m is not equal to 0 |
| Equation solving principles
•For addition , if a=b, then
a+c=b+c
a-c=b-c
•For multiplication, if a=b, then
ac=bc
a/c=b/c |
Given 4x +5= 21 find x
Divide sides
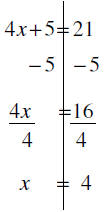 |
Isolate the x
ame action to both “sides”
Same action to both “sides” |
|
| Given − x +1 =1− x find x
Given 5 − 4x = x −13 find x |
Real Problem Solving
•Understand the circumstances
•Write what you know
•Look for an “operation” that gives what
you need to know
•Check for reasonableness
•Clearly tell the answer |
Understand the circumstances 7(3x + 6) =11− (x + 2)
Write what you know
Look for an “operation”
that gives what
you need to know
Check for reasonableness
Clearly tell the answer
|
| Understand the circumstances
Write what you know
Look for an “operation” that gives what
you need to know |
The two most visited national parks are the Great
Smokey Mountains and the Grand Canyon. In 2005
there was a total of 13.6 million visitors to these
two parks. The Great Smokey Mountains had 4.8
million more than the Grand Canyon. How many
did each have? |
| Check for reasonableness |
|
| Clearly tell the answer |
|
|
| Common linear formulae
•Motion
•d= r t
•Simple Interest
•I = Prt |
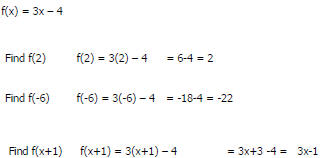
Function notation
With a function, for each input there is exactly one output.
We take an input apply some rule and get a single output
We like the y = 3x – 4 format
x is the input slot, multiply by 3, subtract 4, and it will spit out a value for
y
Some do not like the f(x) = 3x – 4 format
x is still the input and f is the rule ( here it is multiply by 3 and subtract
4)
the output comes by applying the rule of f on the input x
the input does not have to be numbers |
When you are asked for a ZERO of a function you are being asked
what constant will give an OUTPUT of ZERO
OR find f(x) = 0
|
Zeros of functions
•What input gives an output of zero
•Found at x-intercepts
•the x part of an (x, y) coordinate pair
•Later often called solutions
•Linear equations have one zero |
| Find the zeros of the functions f(x) = -2x + 11 GO!
f(x) = 8+x GO!
|
Fundamentals
Reset [2nd] [+] [7] [2] [2] unless you have an old 83 [2nd] [+] [5] [2] [2]
Mode – give many options on how the calculator will run
•Normal Sci Eng sets the notation for how numbers will appear
•Float 0123456789 sets the number of decimals it will display
•Float gives all that are available
•The others tell it where to round to ( if you cannot round use this)
•Radian Degree sets the trig functions to work with i/o of radians or degrees
•Func Par Pol Seq sets the i/o and graphs to work in different mathematical
modes
LEAVE IT ON FUNC FOR THIS CLASS
•Connected Dot changes graph from a solid line to a dotted line
•Sequential Simul tell your calculator to graph equations 1-at-a-time or all at
once
•Real a+bi re^(theta)i sets the number system your calculator will use.
•Full Horiz G-T sets graphs to full screen or split vertical or horizontal |
2 Primary graph types
•[y=] this is the screen where you will enter functions or relations
•This drives the graphing feature of your calculator
•It also drives the TABLE functions(very useful)
•The equation must be solved for y to enter
•If the region around the equal sign is highlighted, the equation is “on”
•If the region around the equal sign is not highlighted, the equation is “off”
•Moving the cursor to the extreme left allows you to change how graphs are
displayed (play with it)
•You can load up to 10 relations, if you like one put it in and turn it off
•[2nd][y=]
•This is the stat plot graphing area
•Select one of the three areas and hit [enter]
•The first highlight tells whether the plot is “on” or “off”
•The TYPE area lets you select the type of statistical plot you want
•Xlist – this is where you tell the calculator where you x data is stored
•Ylist – this is where you tell the calculator where you y data is stored
•Mark – how it is diplayed in graphs |
Table – to use this feature you must first have a relation in your [y=]
Next, to use it appropriately, hit [2nd][window] to enter the Table Setup
window.
•TblStart = Tells the table where to start when on automatic
•Delta Table = Tells the table how much to change the starting value when
you move up or down within the table while on automatic
•For automatic incrimination leave both on auto.
•If you want to enter input values to see what the output values are,
•Ignore the above information
•Go down to Indpnt:
•Move the cursor over Ask
•Hit [enter]
•Hit [2nd][Table]
•X is the input whether automatic or manual.
•If on automatic you can scroll up or down for more values
•If on Ask, type a value and hit [enter]
•The columns relate to the formulae you put in [y=] |