Graphs of Rational Functions
Graph

1. Factor, state domain, and THEN reduce.
Factor:
Domain.
Cannot be reduced.
2. Plot intercepts. For x-intercepts, state whether graph touches
(multiplicity is even) or
crosses (multiplicity is odd) x-axis.
y-intercept
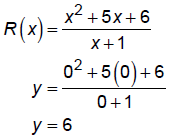
x-intercepts
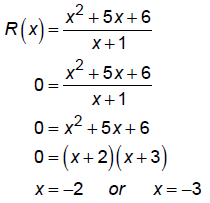
Touch or cross:
x = –2 has multiplicity odd so graph crosses here.
x = –3 has multiplicity odd so graph crosses here.
3. Draw vertical asymptotes (the zeros of the denominator).
x +1= 0
x = -1
x = -1
4. Draw horizontal asymptotes:
deg num = deg denom + 1 so use long division to find oblique asymptote:
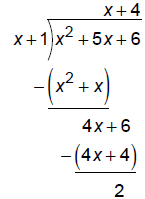
So, there is an oblique asymptote at y = x + 4
5. Plot where the graph crosses a horizontal or oblique asymptote, if it
does.
Find where R crosses horizontal or oblique asymptotes.
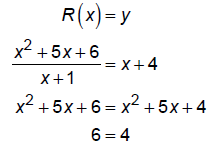
This has no solution so the graph does
NOT cross the oblique asymptote.
6. If needed, plot a few extra points.
R(–6) = –2.4
R(3) = 7.5
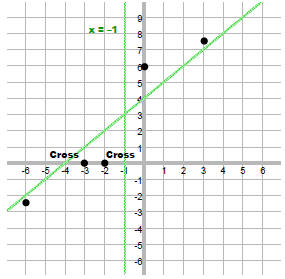
7. Connect the dots.
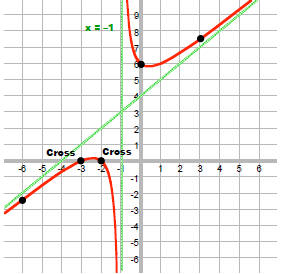
Graph:

1. Factor, state domain, and THEN reduce.
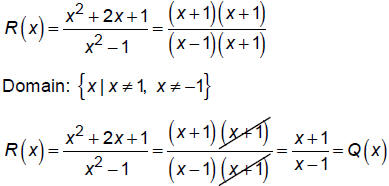
Since the (x + 1) factors cancel, there will be a hole at
x = –1.
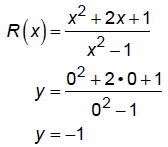
To find the y-value of the hole, find

2. Plot intercepts. For x-intercepts, state whether graph touches
(multiplicity is even) or
crosses (multiplicity is odd) x-axis.
y-intercept:
x-intercepts.

Touch or cross:
x = –1 has multiplicity odd so graph crosses here.
3. Draw vertical asymptotes (the zeros of the denominator).
x -1= 0
x = 1
x = 1
4. Draw horizontal asymptotes:
Degree of p = degree of q so

5. Plot where the graph crosses a horizontal or oblique
asymptote, if it does.
Function = asymptote
R(x) = y
Original function:
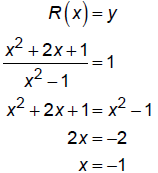
But, x = –1 is not in the domain so R does not cross the
horizontal asymptote.
Reduced version:

This has no solution so R does not cross the horizontal
asymptote.
6. If needed, plot a few extra points.
R(2) = 3
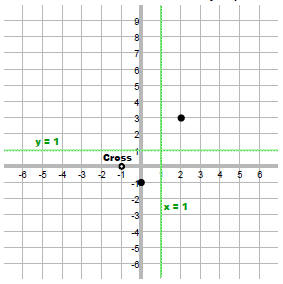
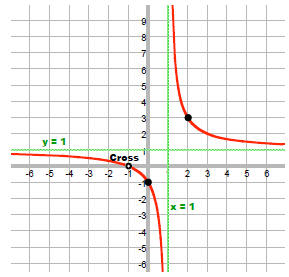
7. Connect the dots.
Note that we can see how the right side behaves by
looking at the multiplicity of the vertical asymptote.
It is odd so the graph must go up on one side and
down on the other.
If it had been even, then both sides of the graph
would have had to go up or down together.
Think of the graph of

versus
 . .
|